Dashboard
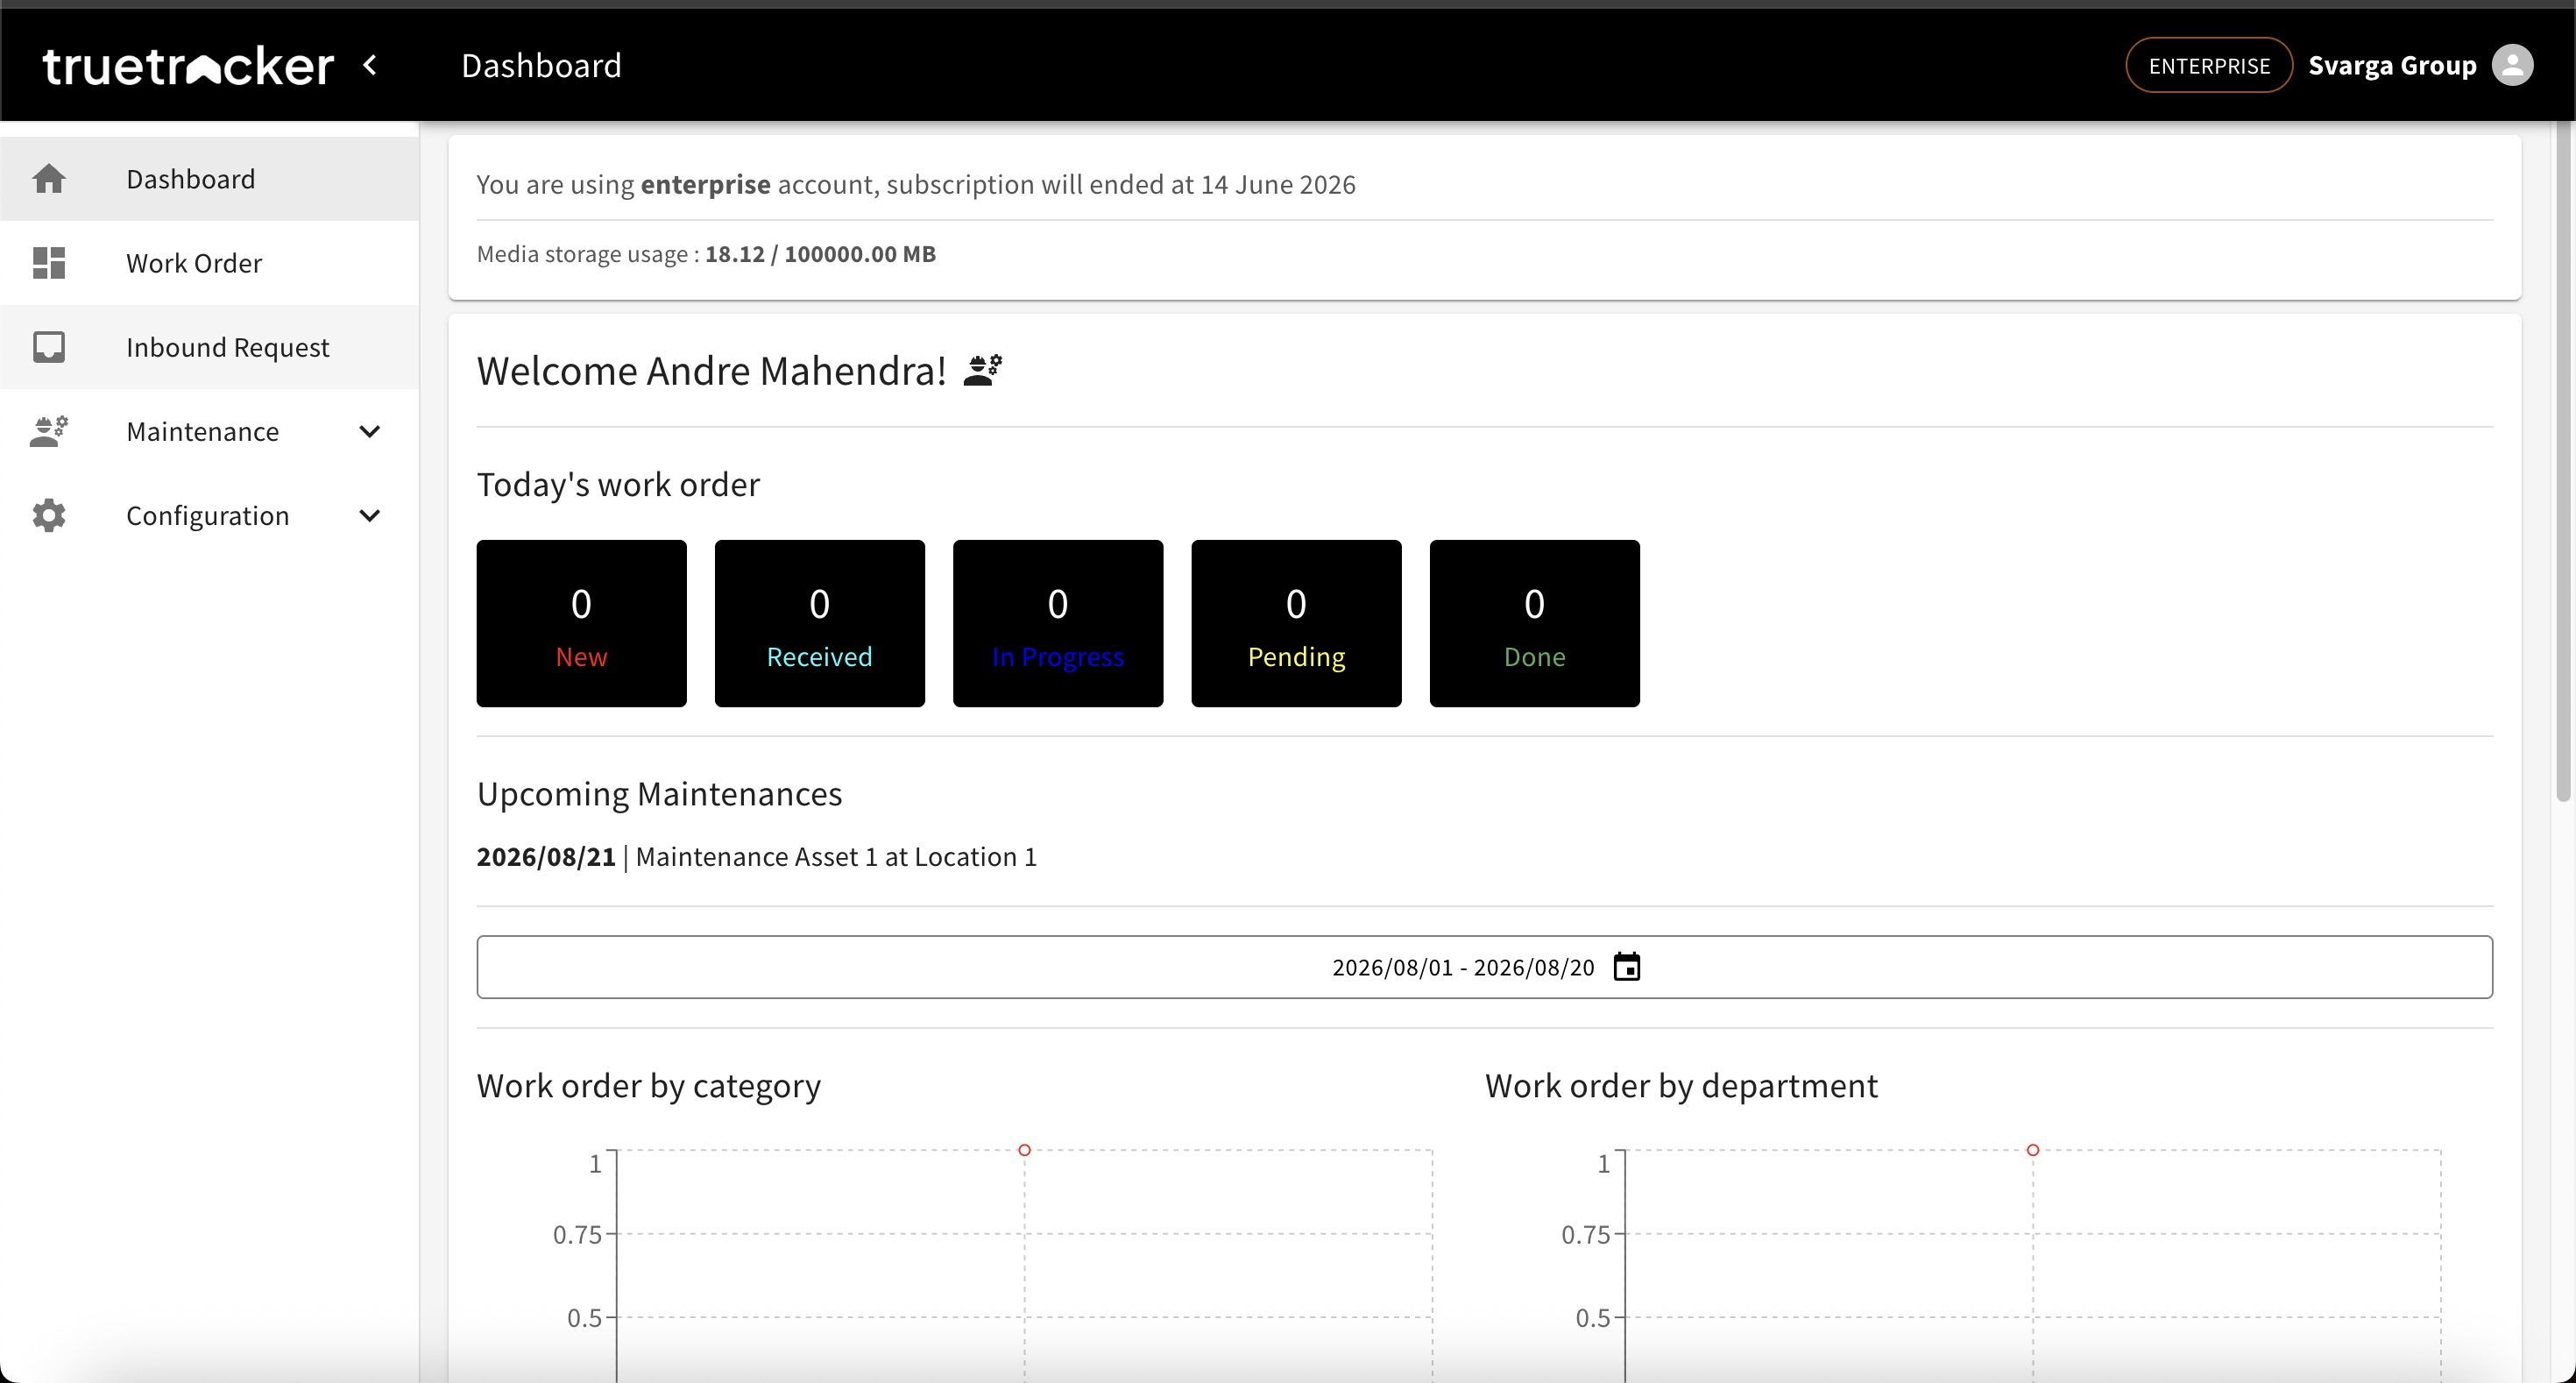
The first thing you see after signing in. The Dashboard sums up where things stand today in one glance, without opening every menu one by one.
Subscription Info
A small card at the top shows your company's plan (e.g. Enterprise), when the subscription ends, and how much of your media storage quota (photos, attachments) you've used.
Today's Work Order
Five number boxes show today's work order count by status: New, Received, In Progress, Pending, and Done — a quick answer to "how much needs attention today" without opening the work order list.
Upcoming Maintenances
A list of upcoming maintenance schedules, each naming the date, asset, and location. You can adjust the date range shown using the date filter above the list.
Summary Charts
Further down are charts that help spot patterns: work orders by category, department, location, and a comparison against the past year. Useful for seeing which area needs the most attention.
Note: the chart legends currently show the raw status names from the system (like "in_progress") rather than a cleaned-up label.