Meters
Some things do not fail suddenly. A compressor does not simply die — its pressure creeps down over weeks. A generator does not blow up overnight — its fuel use climbs slowly until somebody notices the bill looks odd.
Meters are how you catch that while it is still a symptom. You record the number regularly — pressure, temperature, kWh, running hours — and the app tells you when it crosses the line you consider normal.
The idea is simple: rather than waiting for something to break, you watch its numbers.
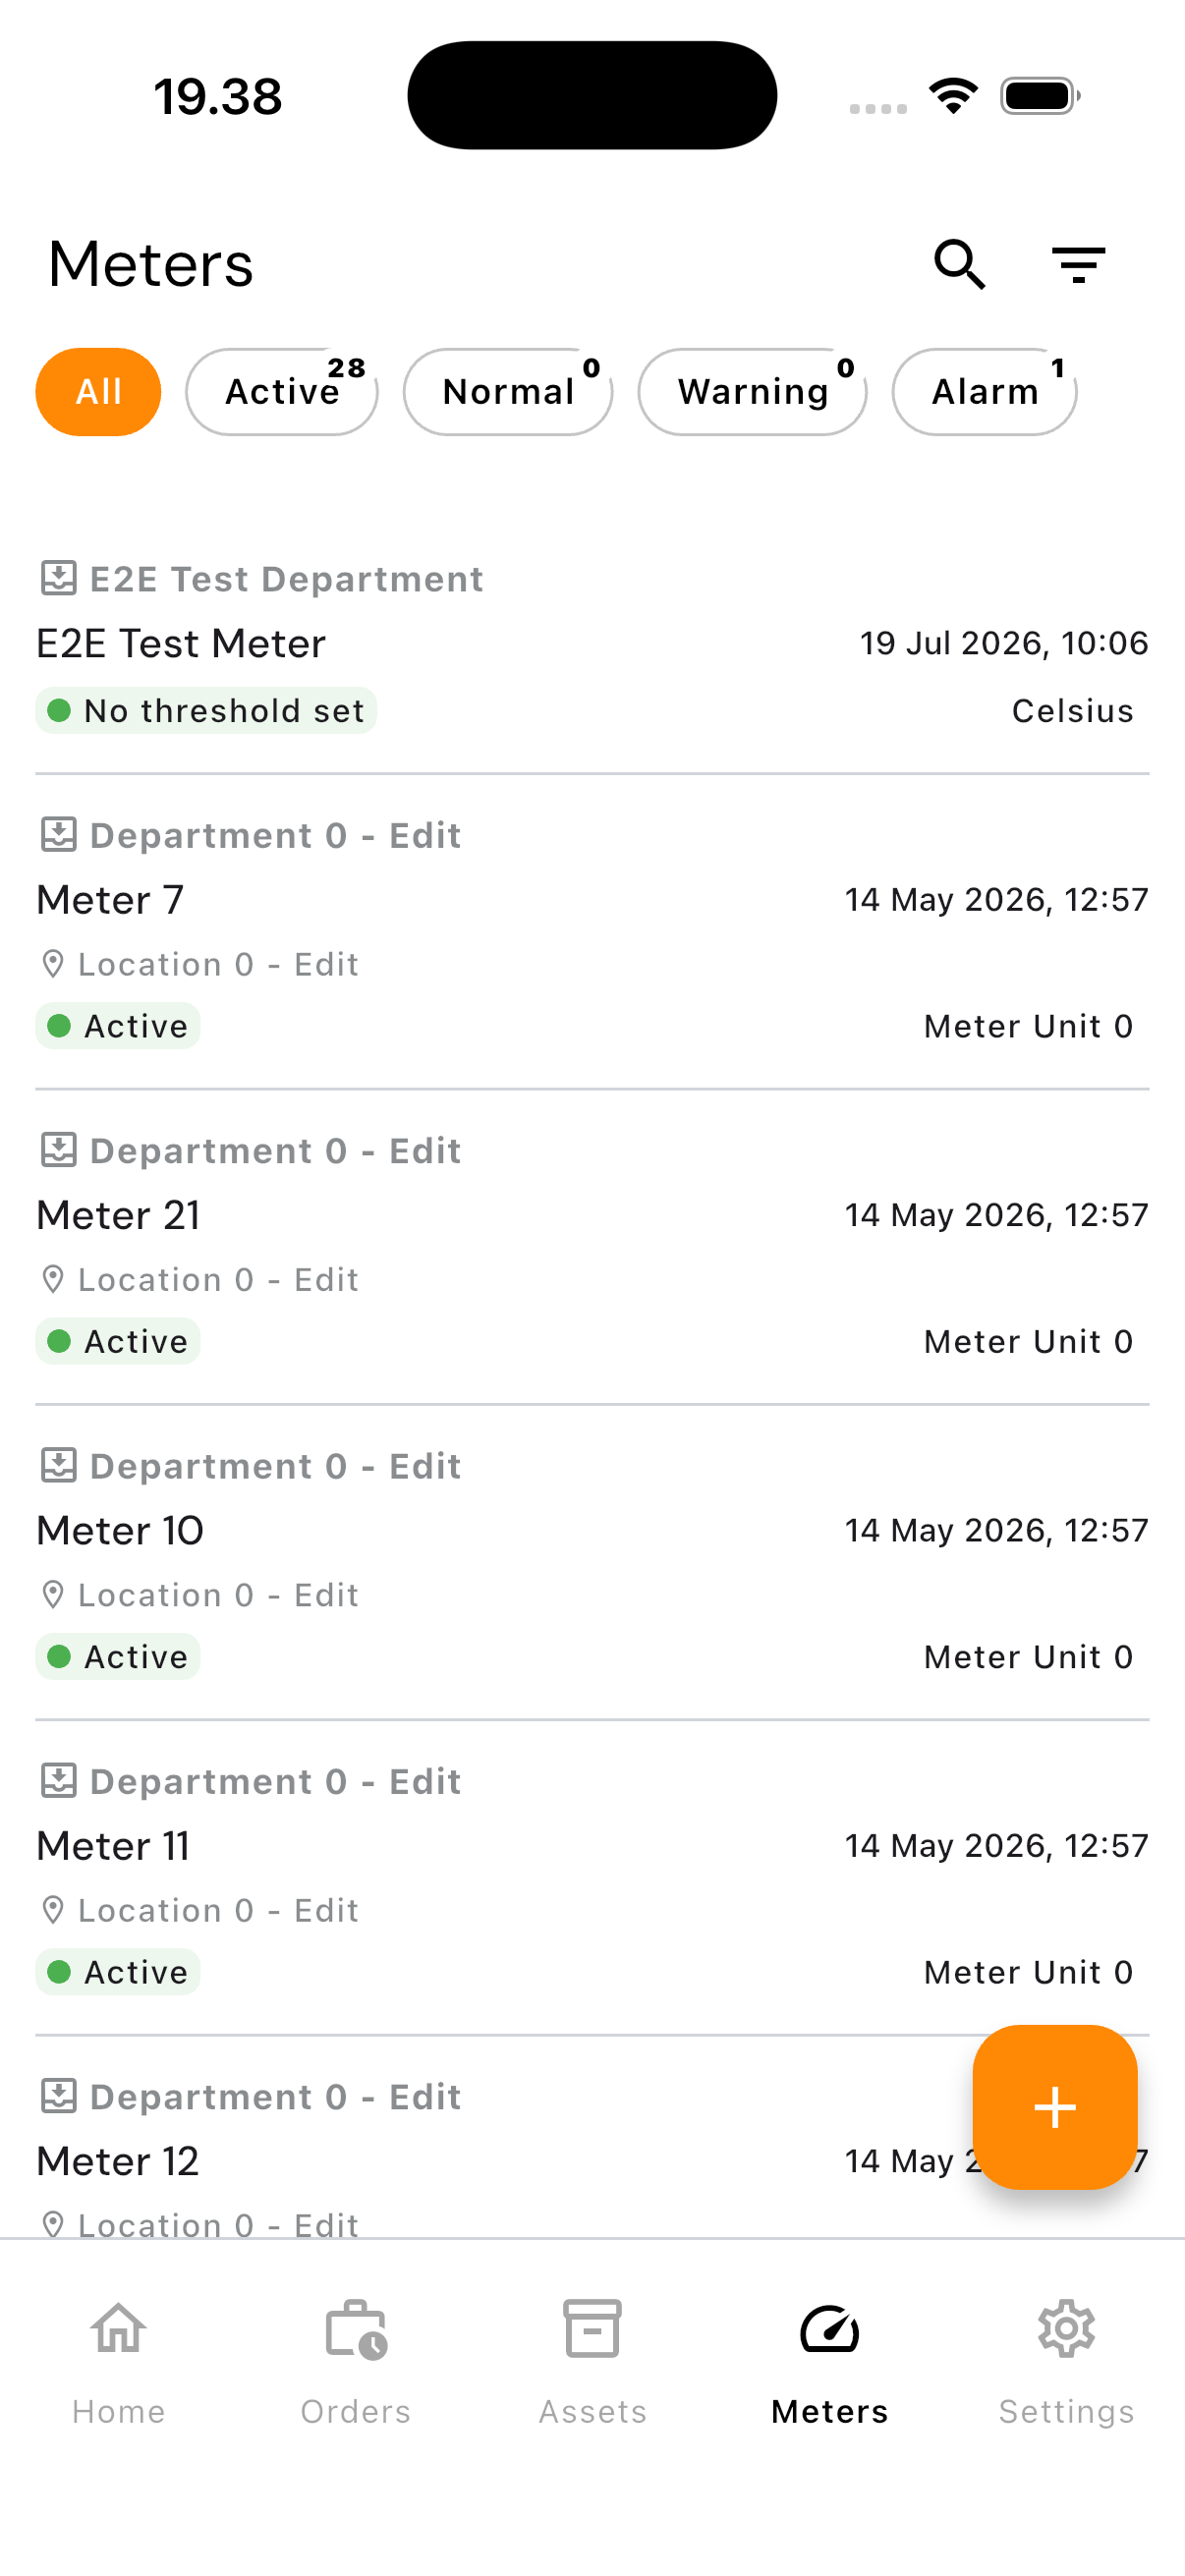
Opening the Meter List
Tap the Meters tab at the bottom of the screen.
Reading the List
Picture yourself arriving in the morning wanting to know where things stand. The chips across the top answer that at a glance:
| Chip | What it means for you |
|---|---|
| All | Every meter, unfiltered |
| Active | Meters currently being tracked |
| Normal | Fine, nothing to do |
| Warning | Drifting away from normal — worth checking this week |
| Alarm | Past the limit — deal with it today |
The small number on each chip is the count. If Alarm shows 0, your morning is clear.
Each row tells you the owning department, the meter name, its location, its status, when it was last read, and its unit. That last-read date is often the most telling: a meter nobody has read in a month is not safe, it is simply unchecked.
When the list is empty it reads "No meters found".
Setting Limits That Mean Something
Every meter has two limits, and you decide what they mean.
Warning Threshold is the "start paying attention" point. Not urgent, but outside the usual.
Alarm Threshold is the "stop and deal with it" point.
Take an electrical panel's temperature: Warning at 60 °C, Alarm at 75 °C. Below 60 the status stays Normal. Past 60 it becomes Warning, and a technician has time to schedule a look. Past 75 it becomes Alarm, and something needs doing now.
With no limits set, the status reads "No threshold set". The app does not guess: without limits it has no idea which numbers are bad. Such a meter still records history, it just cannot warn you.
Getting the limits right usually takes a few weeks of data. Starting with an estimate and correcting it once you have seen what normal looks like is perfectly reasonable.
Recording a Reading
This is the part you will do most often, out in the field:
- Open the meter
- Tap Add Reading
- Enter the Reading Value — the number on the gauge
- Check the date and time. Change it if you are recording this later, so the chart stays honest
- Add a Note if anything was unusual. "Measured 10 minutes after shutdown" can explain an odd number months afterwards
- Save
The meter's status updates immediately. If the number crosses a limit, the status changes there and then.
Looking at the History
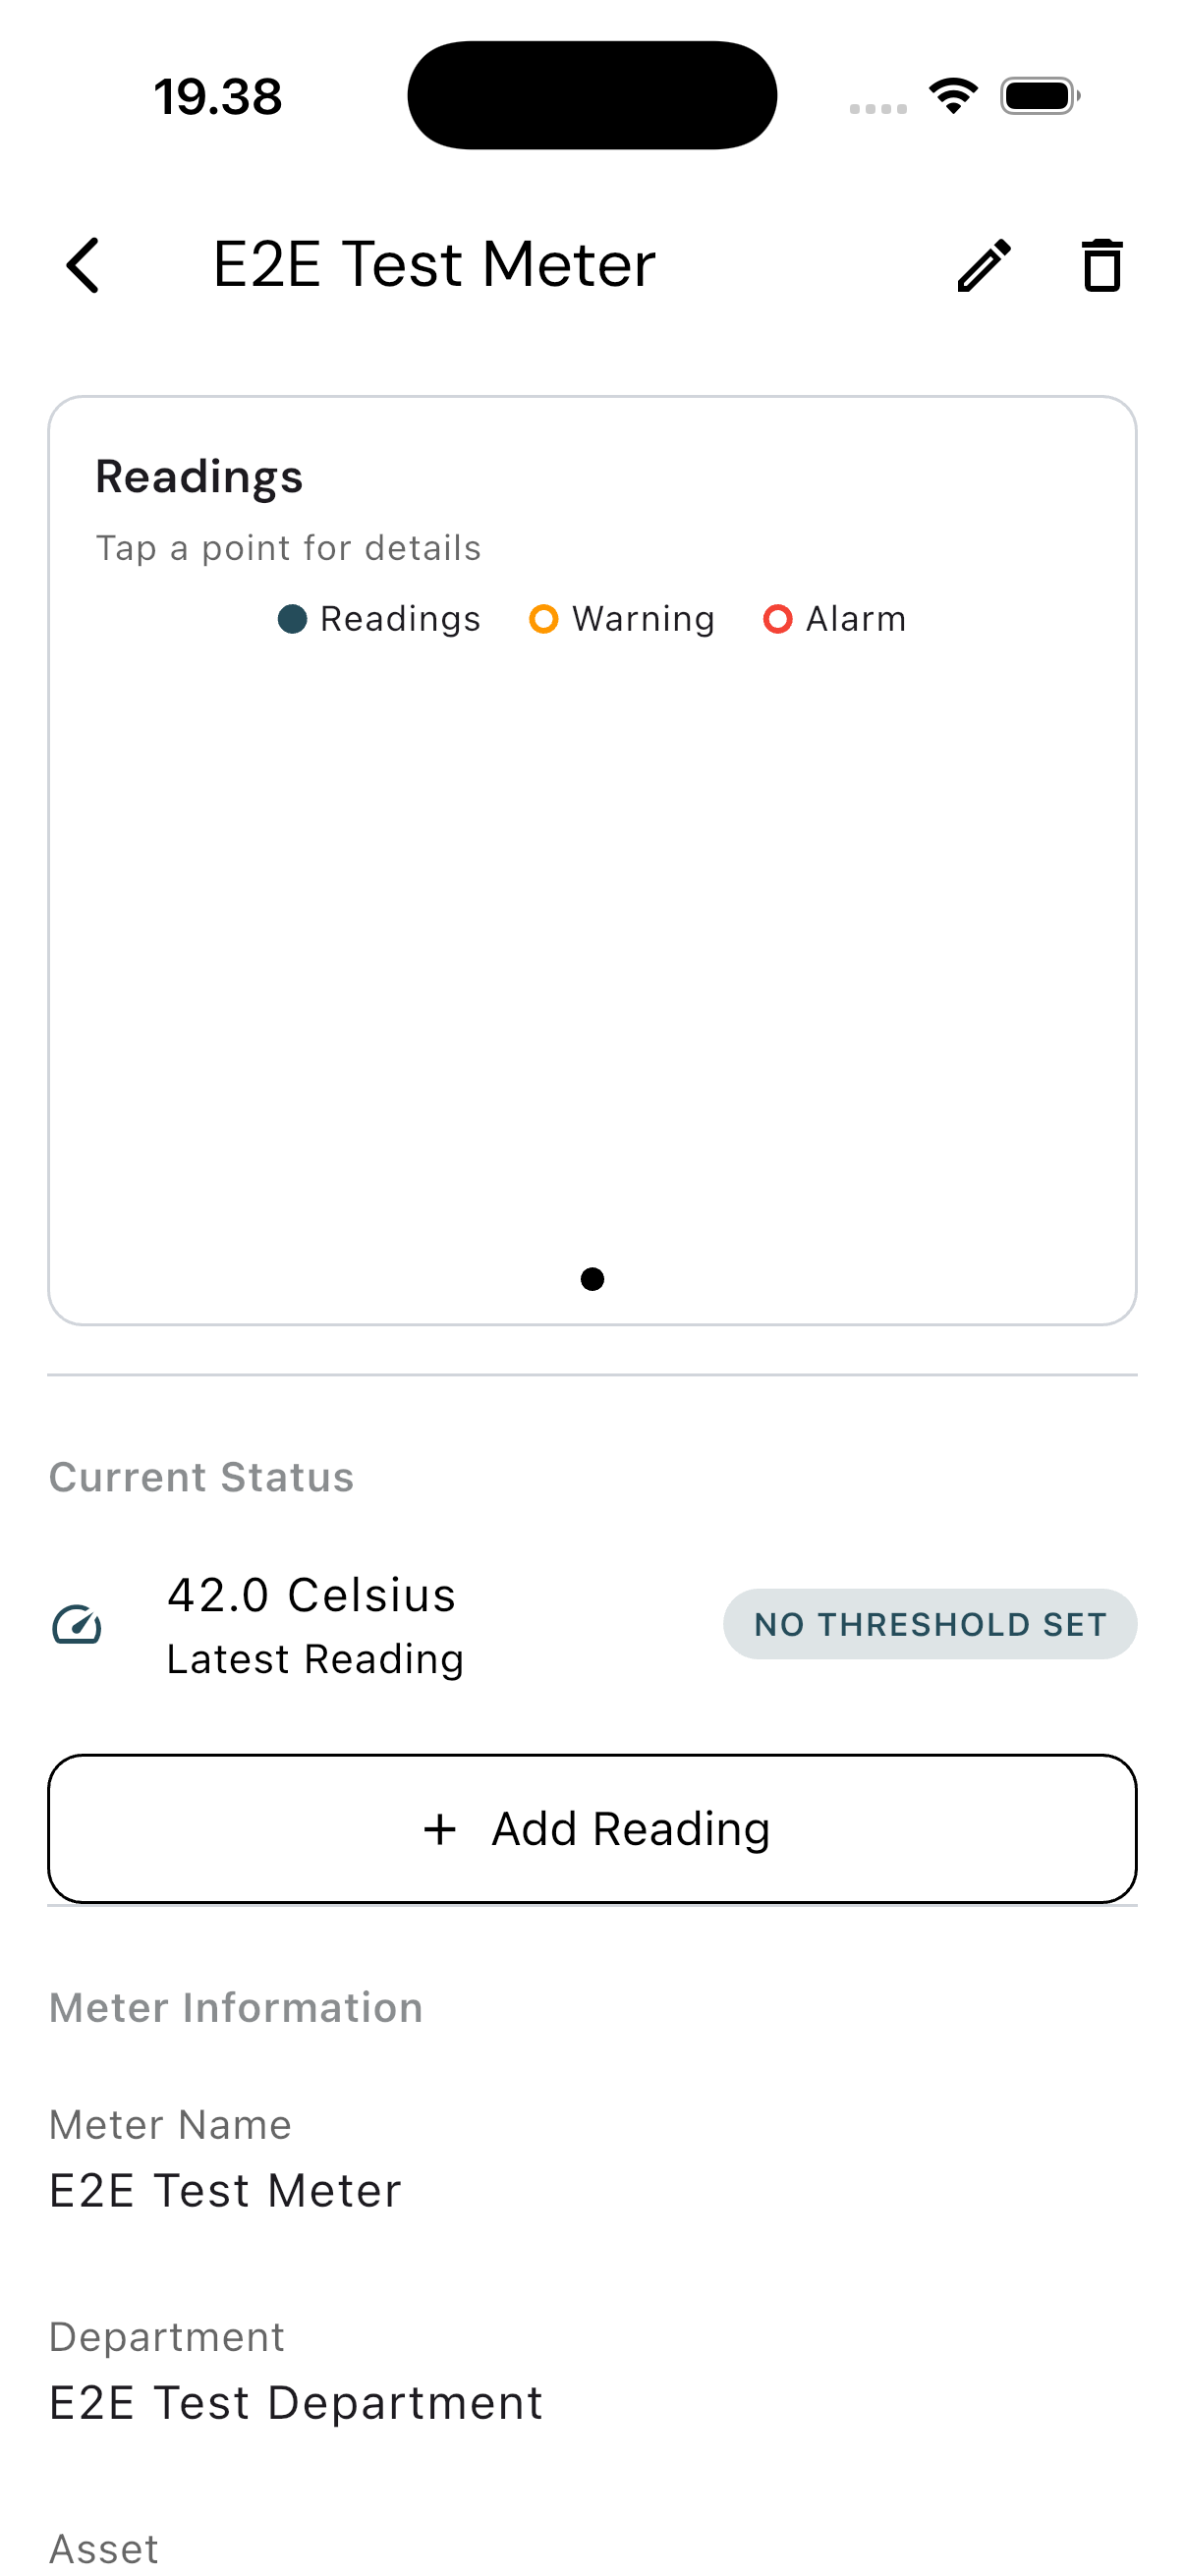
The detail screen shows Current Status and Latest Reading at the top — where things stand today.
Below that is the chart, and this answers the more important question: not "what is the number now" but "which way is it heading?" A line that has crept up over three months deserves more attention than a single spike that came straight back down.
Tap any point on the chart to see that reading, including the note written at the time. Tap See All for the full history.
A new meter shows "No readings yet" until you record the first one.
Creating a Meter
Available to the Admin and Head roles.
| Field | What to think about |
|---|---|
| Meter Name | A name the people in the field will recognise, not an internal code. "Compressor Pressure, Warehouse B" beats "MTR-07" |
| Unit | kWh, Celsius, Fahrenheit, PSI, Bar, RPM, Volts, Amps, Liters, or Cubic Meters |
| Warning Threshold | When you want to start paying attention |
| Alarm Threshold | When something must be dealt with promptly |
| Description | Where to write how it should be measured, so two people produce comparable numbers |
Deleting a Meter
Open the meter and choose delete. The app asks for confirmation first.
Bear in mind: the whole reading history goes with it. If a meter is out of use but its data still tells a story, leaving it alone beats deleting it.